
Sample text 123
The Statistical Consulting Center provides support in following areas:
The CMU-Q Statistical Consulting Center holds workshops in key areas of quantitative analysis. Past topics have included:
Introduction to R for Data Visualization and Analysis
R is a language and environment for statistical computing and graphics. This workshop covered the basics of R, with hands-on practice using R to analyze and visualize data.
What Statistical Analysis Should I Use?
This workshop covered the data analysis workflow, along with various statistical methods. Participants learned to choose the right statistical method for their research question and data.
Data Visualization with Tableau.
This workshop showed participants how to use Tableau to visualize and understand various types of data.
Data Visualization and Statistical Analysis with SPSS
This workshop covered how to use SPSS to visualize and analyze various types of data.
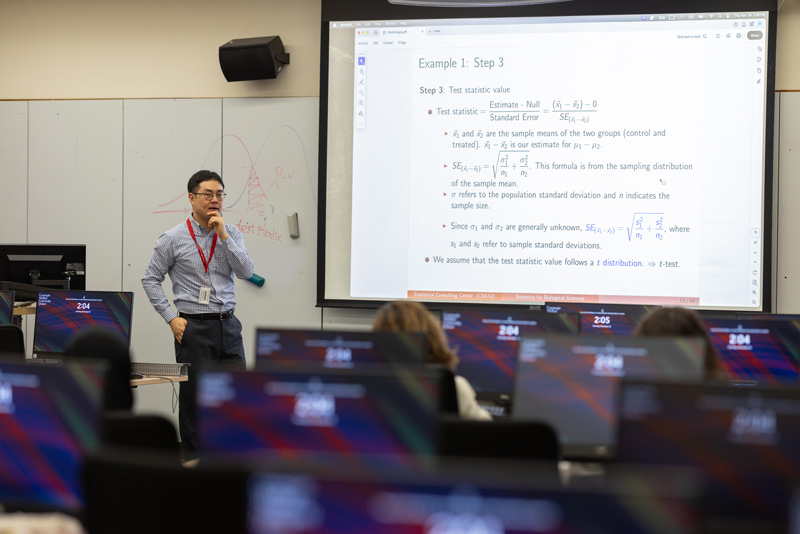
Introduction to Statistics for Biological Sciences.
This workshop introduced statistics to biological scientists with hands-on practices using R.
What statistical analysis should I use?
Data visualization with Tableau
Data visualization and statistical analysis with SPSS
Contact:
Taeyong Park,
Assistant Teaching Professor, Statistics
Director, Statistical Consulting Center